Velocity Vector Comparison Project
Summary:
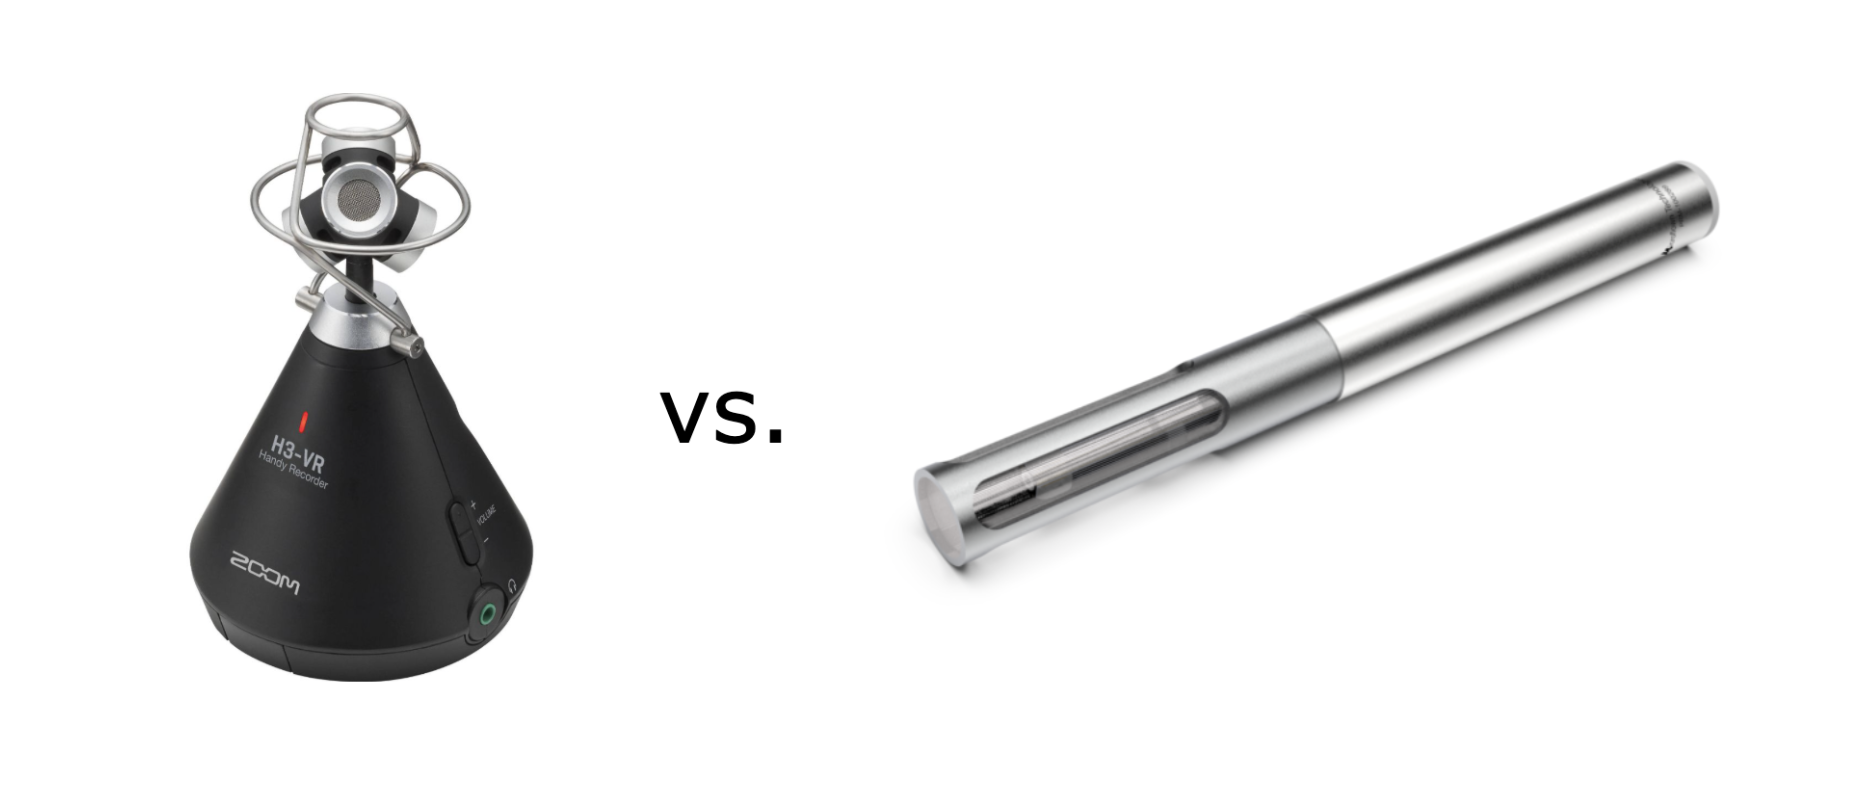
Sound intensity probes are expensive due to their high precision and calibration. This project investigates a lower-cost alternative, using a tetrahedral mic array. By applying our own calibrations and calculating the velocity vectors, we evaluated the performance of a Zoom H3-VR ($250) against measurements obtained with a Microflown intensity probe ($12,000).
Microflown:
First, we collected data using the Microflown. A MATLAB script was used to generate a sine sweep from 100 Hz to 12.8 kHz, which was played through a small loudspeaker with a two-inch driver. The probe comes with calibration values that compensate for measurement inaccuracies. After applying these corrections, the recorded measurements were treated as our “ground truth” reference. The probe outputs four channels corresponding to the acoustic pressure and the three components of the acoustic velocity vector (p, Vx, Vy, Vz).
Zoom H3-VR:
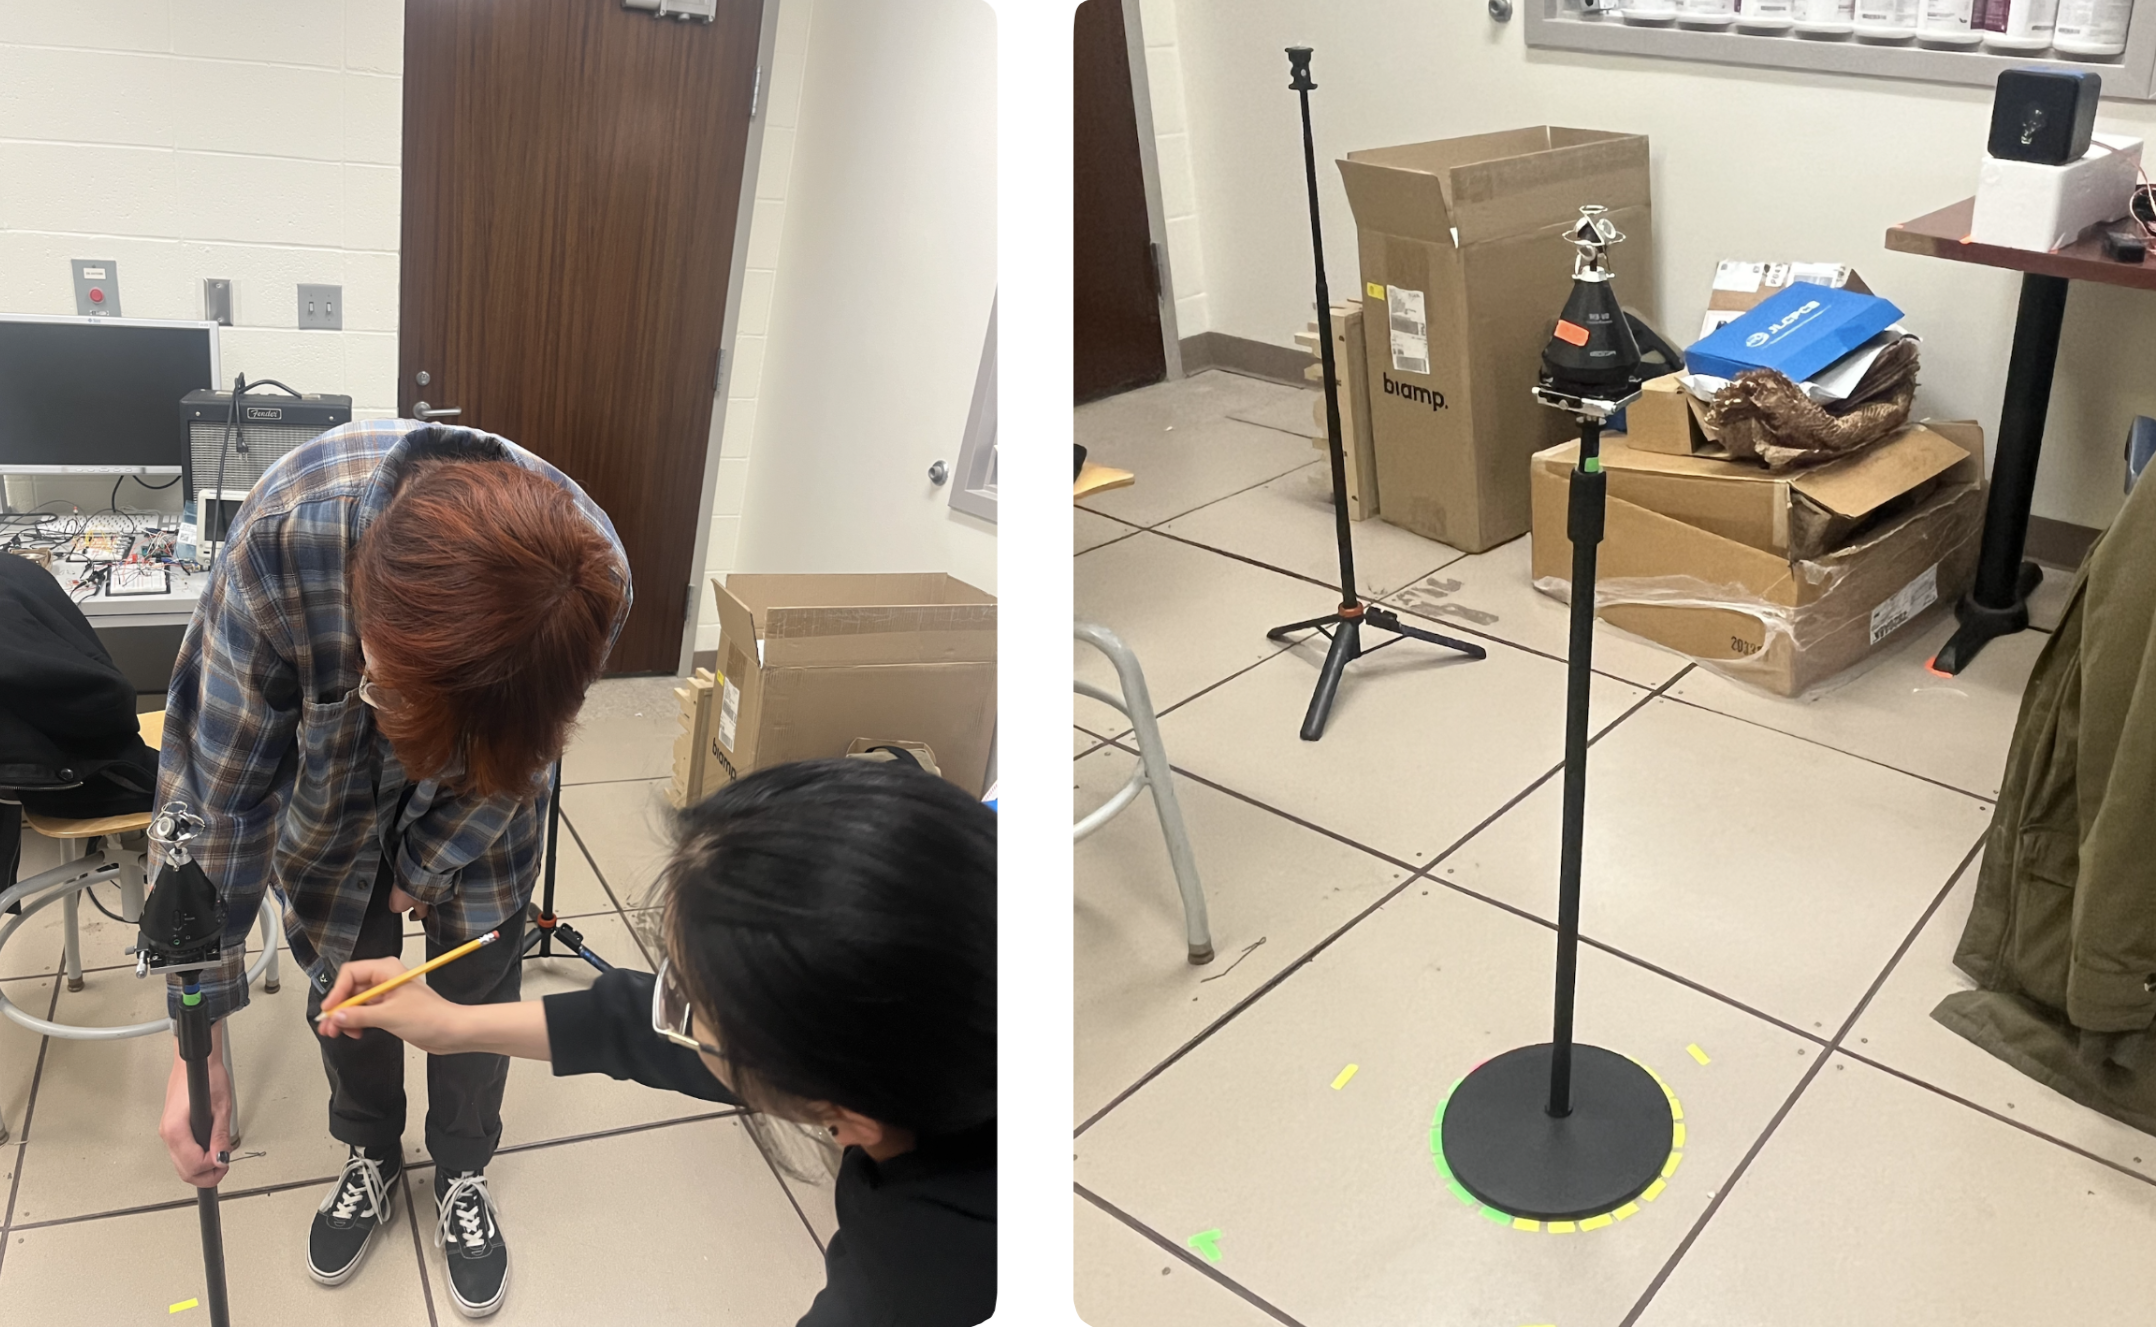
We started by recording the same sine sweep with the Zoom H3-VR tetrahedral mic array. In the H3-VR, four capsules are used to sample the acoustic pressure field. To compensate for differences in the capsules, amplitude calibration was performed. We rotated the H3-VR and measured the relative differences between the recorded signals when each capsule was facing the speaker. Scaling factors were then determined and applied to each channel to correct for these differences. The calibrated recordings were subsequently used to calculate the acoustic velocity vectors.
Results
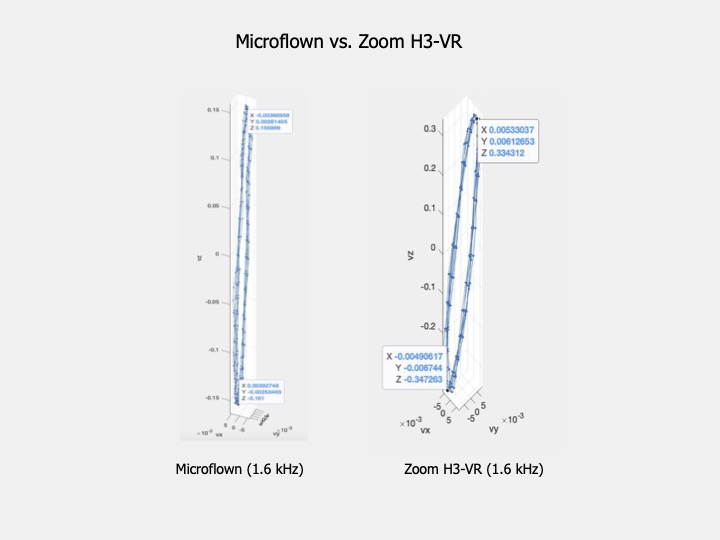
Below is an example of the results we achieved. Overall, mathematical calibration allows for somewhat effective intensity mapping at lower frequencies, but it lacks precision. Upper-frequency performance is bound by the physical spacing of the capsules, as the spacing causes phase differences which grow as the frequency increases.
Another issue we encountered in our data was reflections. We tried to address this by switching to a WhisperRoom booth and gating the recordings, which led to some improvement in the results. The ideal response would be a straight line but in our results, the loops were mostly caused by a lack of sound insulation in the measurement environment.